To jump to the live code, click here and view source
A recurring pattern of my daily habits; Start on some task. See something else that peaks my curiosity. Begin to understand this new thing; Then get carried away down the rabbit hole to things completely tangential to my original task.
And that is exactly what happened when I came across the ebay tech blog for an article on, fast approximate logarithms, but ultimately what really caught my attention was their blogs header graphic.

It sparked my curiosity and was simplistic enough to recreate in an afternoon. What follows is my thoughts and the process of recreating it in code.
Write It Down!
I like to describe in words the visual and literal elements that make up the graphic. It helps to untangle my thoughts and bring to the forefront what exactly makes the graphic appealing to me.
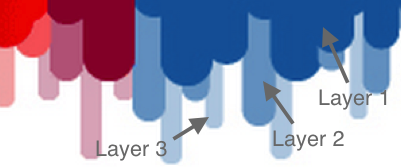
What originally caught my attention was how the graphic gives a sense of depth and feels almost organic. This quality originating out of decreasing widths, semi-random overlap, and varying opacities of each of the rounded streaks.
Starting from the largest attributes, there are 4 primary repeating sections. Each section has a uniform total width, slighting overlapping with the next section and colors matching the ebay brand.

Further breaking down the sections, each has 3 distinctive layers with different attributes to their streaks. I define the bottom most layer, to be the layer with the lowest opacity, smallest width, and on average the longest streak. Each successive layer has an increase to its opacity and width, but has a lower average height.
Now that the aesthetic attributes have been defined, we can begin to slap together some code to convert this ugly mess of words back into something resembling the original graphic.
I am going to use SVG here for its scalability and my comfortability manipulating it with d3.js. d3 d3: If you havent been exposed to d3's data manipulation concepts I recommend the tutorial 3 little circles by the creator himself, Mike E Bostock.
Code
First, I need the beginnings of an ideal skeleton. Just something wrap my head around and I can glance to as I write out the JavaScript logic.
<svg id="graphic">
    <g class="color1">
        <g class="layer1">
            <rect></rect>
            <rect></rect>
            <rect></rect>
            ...
        </g>
        <g class="layer2">
            <rect></rect>
            <rect></rect>
            ...
        </g>
         <g class="layer3">
            <rect></rect>
            <rect></rect>
            ...
        </g>
    </g>
    <g class="color2">...</g>
    <g class="color3">...</g>
    <g class="color4">...</g>
</svg>
It's basically a direct translation of my prior written description in SVG markup. Now that I have some structure outlined I can begin modifying the varying attributes of each different color, layer, and rectangle.
Variables
A few top level variables will help keep things clean and organized. I need colors of course, dimensions for the svg. I'm using a viewbox so the units stay the same no matter how much the final svg is scaled by. I am also defining a config object which will help me fiddle around with a few parameters like how much the streaks should overlap, how big of a change in opacity for each layer, the maximum heights, etc.
var colors = ['#D7182B', '#0A4FCB','#EF9F00','#79AD00'];

// Units I work in for svg space
var dim = 100;
var viewBox = [0, 0, 100, 100];

// How much space each color gets
var availSpace = dim / colors.length;

var config = {
    colors: colors,

    // How many different levels of streak
    numDepth: 3,

    // Omitting the rest for clarity...
    ...
};
In the final config object, I have far more variables but in the spirit of clarity, I am omitting them. As I show more code snippets you will see the other config variables used in context and consequently will give you a better understanding of what they do.
Next I need to create the arrays holding parts of the SVG structure. And this is where you can see how d3.js maps data to elements comes in handy.
// top level container
var svg = d3.select('#graphic').attr('viewBox', viewBox);

// color1, color2, ...
var sections = svg.selectAll('g')
    .data((d3.range(config.numColors)))
    .enter().append('g')
        .attr('class', (d, i) => {return 'color-section-' + i; });

// layer1, layer2, ...
var layers = sections.selectAll('g')
    .data((d3.range(config.numDepths)))
    .enter().append('g')
        .attr('class', (d, i) => {return 'layer-' + i; });
Simple enough if you know how d3.js selection and appending works.
Visuals
Now comes the fun part of applying the visual styles to everything. Sections and layers are the main concepts which have artistic attributes. I apply JavScript logic to set colors, fills, and dimensions to build up the look I want.
Sections
The simplest attribute or deviation from just laying out the colors is the slight overlap between successive colors. I.e. the overlap between red and blue, blue and yellow, and yellow and green.
sections.attr('transform', (d, i) => {
    let noise = d3.random.normal(0, config.overlapNoise)
    let offset = (availSpace * i) + noise();
    return ['translate(', offset, ',0)'].join('');
});
The important point of the above code is how the offset has a bit of randomness applied to it. If your also confused about what the return output is supposed to look like, here is an example:
"translate(0.4,0)"
Layers
Now here comes the more complex logic and far more important code in crafting the look.
// Setting the color and opacity of each layer
layers.each(function(d,i) {
    let color = d3.hsl(d3.select(this.parentNode).datum())
            // darker on higher layers
            .darker(i * config.darkenStep)
            // brighter on lower layers
            .brighter((config.numDepth - 1 - i) *
                             config.brightenStep)

    let layer = d3.select(this);

    layer.attr('fill', color)
         .attr('stroke', color)
         .attr('opacity',
                config.opacity + (config.opacityStep * i))

    });
I will walk through this bit by bit. First off, its important to realize mapping this-context over all layers and that I rely on color set on the parent element (the section colors). The first line gets the color, parses it into a hsl object and then applies color changes based upon the layer depth. The second half of the function simply applies the color and also sets the opacity based on depth as well.
At this point if we were to give some heights to our rectangles, it would look something like this:

So far we have Section overlap between colors. You can tell the opaciity is varying between layers because at the overlap their is some blending of color. And if you looked at the underlying code you would see the different colors of each layer. However the most important piece is missing. The varying heights and widths of each streak.
Organic Look and Feel
Before I go and add in the code to handle varying heights and widths, I need to make a change to the structure. I need to use path elements instead of rect. This is due to the limitations of border radius. I cant individually discriminate between corners with a rect. However I can create a path which emulates a rectangle with only the bottom corners rounded. The code below is modified from a stack overflow question .
It probably looks confusing if you havent seen a custom svg path before. However, explaining to you the short commands for creating a custom path object is out of the scope of this article. And to be honest I could not explain them if I tried. But a quick overview and tutorials are out there.
Next up is handling the heights of the specific streaks. To do so I have to walk through each of the layers as I did previously and call the rounded_rect() function I showed you earlier.
layers.each(function(d, i) {

  // Uniform width for each streak
  let width = config.width + (config.widthStep * i);
  let streakWidths = d3.range(0, availSpace, width);

  // Height Range
  let rHigh = config.heightMin + (config.overLap * (config.numDepth - i));
  let rLow = rHigh - config.overLap;
  let rNoise = d3.random.normal(0, config.heightNoise);

  // Each streak
  d3.select(this).selectAll('path')
    .data(streakWidths)
    .enter().append('path')
      .attr('d', (d) => {
        let height = 0;
        // force this streaks min to a lower bound
        while (height < config.heightMin) {
          height =  Math.random() * (rHigh - rLow) + rLow + rNoise();
        }
        let radius = width / 2;
        return rounded_rect(d, 0, width, height, radius);
      });
});
And there you have it. The most important piece is the little bit of decreasing Gaussian noise which does 90% of the work to recreate the original look.

For the live code,, click here
Curiosity, the feeling I get whenever I see vibrant, repetitive design. In fact, I rely on my curiosity to drive me to improve and deconstruct everything I come across. My goal is to continue with this for as long as I live.
Matthew, pay attention to details, continually improve and most importantly, keep up your curiosity.
I challenge you to do the same, Good Luck.
- Also I can't use a es6 arrow functions here. This constraint comes from how arrow functions capture the
thisvalue of the enclosing context and ignore thecall()orapply()methods. But d3.js works by injecting the current selection onto the variablethis. See .each() and mdn arrow to understand deeper. ↩